This is the Outer Banks Real Estate update for the week ending June 20th the last week of Spring! Along with the weekly stats, we’ll look a little deeper into the current pace of the market.
The Stats
Residential not including co-ownership, week ending June 20th, data retrieved June 21st, the first day of Summer, and just after the first tropical disturbance of the season, Claudette, moved through:
55 units sold. The average list price was $665,123. The average sold price was $657,898. The median list price was $560,000. The median sold price was $539,000. Average days on market 50, median days on market 5.

55 homes went under contract. The average list price was $643,663. The median list price $499,900. Average days on market 38, median days on market 9.

There were 62 new listings. The average list price was $742,548. The median list price of $564,500. 14 of those are already under contract or off of the market, 48 are still active.

Active Listings and Market Pace
At the time the data was pulled there were 401 active listings compared to 965 at the end of June 2020, and 1579 and the end of June 2019. The average list price is $906,009. The median list price is $647,220.

To keep you up to date with the pace of the market, going back to the previous week ending June 13th, there were 61 new listings, 26 of which are now under contract, or off of the market. 35 are still active. Going back two weeks to the week ending June 6th, out of 56 new listings 31 are under contract, sold, or off of the market. 25 are still active. Going back three weeks to the week ending May 30th, out of 79 new listings 41 are under contract, sold, or off of the market. 38 are still active.
Market Pace – Deeper Dive
I mentioned last week that it felt like the pace of the market slowed just a bit. A deeper dive into the weekly stats seem to confirm this.
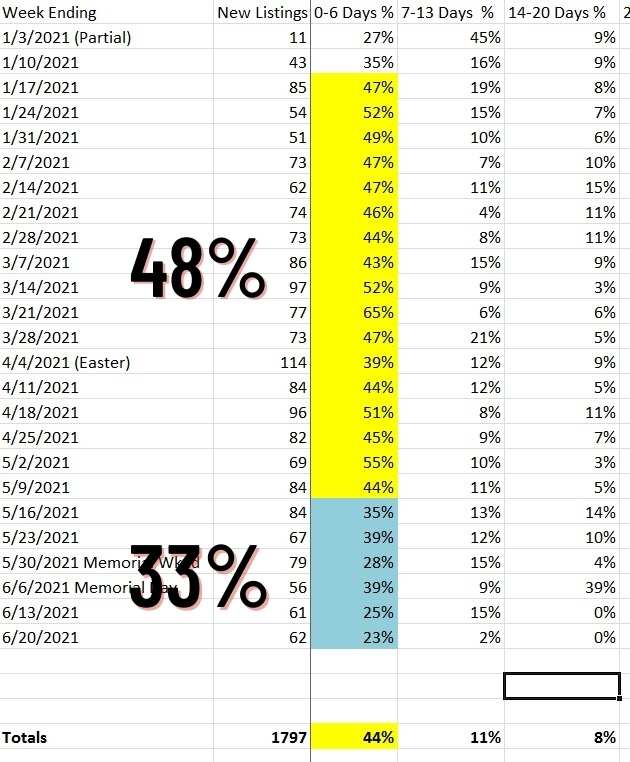
The percentage of residential properties going under contract within the first 7 days is down. For clarification, in the MLS the first day is day 0. If you look at the percentage of properties going under contract in the first week, you’ll see that beginning with the second full week of January that figure hovers in the upper 40’s to low 50’s. 47%, 52%, some upper 40’s, 65% one week followed by 39% then back up, you see what I am saying. If I isolate those weeks, through the week ending May 9th, the average is 48%. The average for the year so far is 44%.

So look at the weeks ending May 16th through June 13th, we can’t factor in last week’s figures just yet as they are incomplete. 35%, 39%, 28%. The average of those weeks is 33%, 11% lower than the yearly average.
Don’t get me wrong, that is still a very hot seller’s market. The week ending June 14th, 2020 saw 30% of the new listings go under contract in the first 7 days. But in 2019 that number is 3! Not percent, 3 homes out of 68 new listings. That’s .044%!
If you are a seller the prime opportunity to sell quickly for top dollar is now, and won’t last forever.
My June market update with a look at the Outer Banks Association of Realtors May Statistical Report is out. You’ll find it on the Moose OBX Facebook page, Moose OBX YouTube channel, at Moose OBX dot com, and featured in the real estate section at OBX Today.
As always, If you have questions about a specific area or need help with your situation give me a shout. All of my info is at move2obx.com.
Information in this article is based on information from the Outer Banks Association of REALTORS® MLS for the period January 1, 2019, through June 21st, 2021.

